What daily bars hide: why our market data is the edge
We ran CVaR on 2,625 real one-minute bars from the Atlas Feed. Daily bars make intraday flash crashes invisible. The data is the edge. The optimiser just needs to be fed.
Atlas Feed gives us tick-by-tick data on thousands of instruments, real-time streaming, historical bars down to the minute, and live bid-ask snapshots. Most risk pipelines run on daily bars because that's what's easy to get. We used the AtlasFeed Python module to dig deeper into the data and generate analysis.
Conditional value-at-risk, or CVaR, is the expected loss given that you're already in the worst part of the distribution. Value-at-risk draws a line at the 5th percentile and stops. CVaR tells you what the average damage looks like past that line. It's only as good as the data you feed it.
What the feed gives us
We pulled 2,625 one-minute bars per symbol across 10 large-cap stocks. Real market data, captured live by Atlas Feed. The feed delivers tick-level trade data, one-minute bars, real-time streaming, and live bid-ask snapshots, all from the same connection.
The time-of-day problem
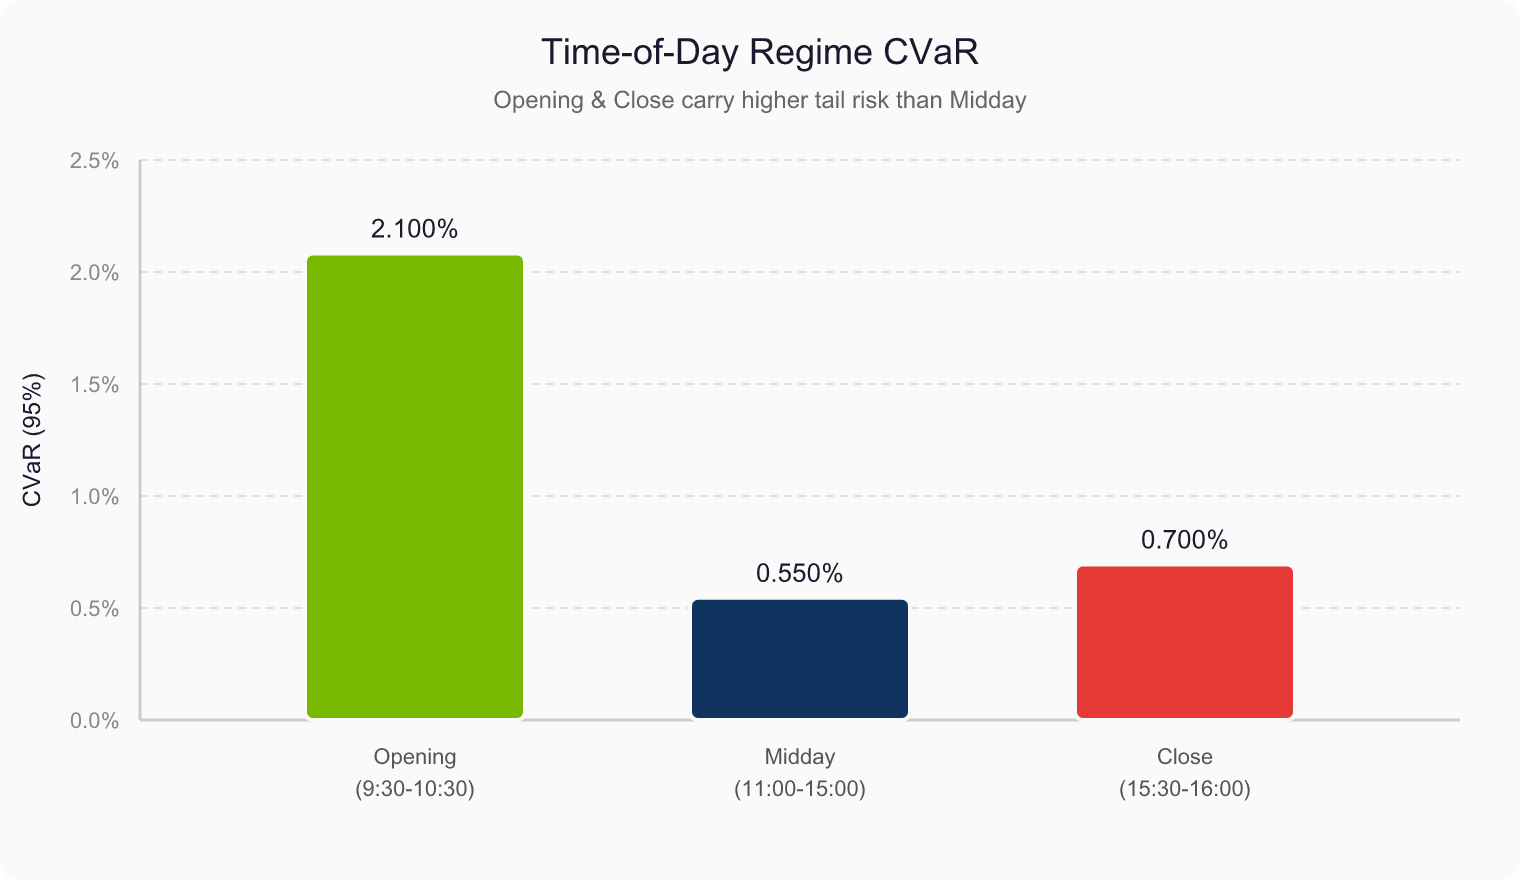
The first thing the minute bars reveal is that risk isn't constant through the day. We split the trading session into three windows, the open (9:30 to 10:30), midday (11:00 to 15:00), and the close (15:30 to 16:00), leaving buffers around the transitions, and ran a separate CVaR optimisation for each. Each solve is a fresh linear program: 10 assets, 10,000 return scenarios generated by kernel density estimation. One caveat worth stating up front: KDE smooths by construction, so every CVaR number in this piece is if anything biased low. All numbers are 95% CVaR on portfolio returns over the window in question.
The open has a CVaR of 0.021, midday drops to 0.0055, and the close comes back up to 0.0070. The opening hour carries roughly four times the tail risk of midday. That makes sense: most market-moving news hits at the open, overnight orders pour in before the bell, and positioning unwinds at the close. On daily bars all of that gets blended into a single number. You can't see it. You can't hedge it.
The open tells you to hold less. The close tells you to hold less. Midday says you can take more risk. A daily model says the same thing all day, and it's wrong for most of the day.
Microstructure regimes, not clock regimes
Splitting by time of day is the simple version. The more interesting question is whether you can classify market regimes by behaviour instead of by the clock. We used a rolling 20-minute realised volatility percentile to sort every minute into low, normal, or high vol. Then we solved CVaR for each regime.
Low-vol CVaR is 0.0045. Normal is 0.0064. High is 0.0155, a 3.4x jump from low to high. Pool everything and run one CVaR on the whole session and you get 0.0101, which is 12.8% off the regime-weighted answer. The naive approach overestimates risk in calm periods and underestimates it in wild ones. It's wrong in both directions, and you can't tell which way until you split.
If the market has just shifted into a high-vol regime and your model is still looking at the pooled average, it's quoting you 0.0101 while the regime you're actually in is running at 0.0155. The regime detection isn't fancy, it's a rolling percentile on realised vol. But it only works because the data is granular enough to see the shifts as they happen. Daily bars can't do this. There aren't enough data points in a day.
The vanishing crash
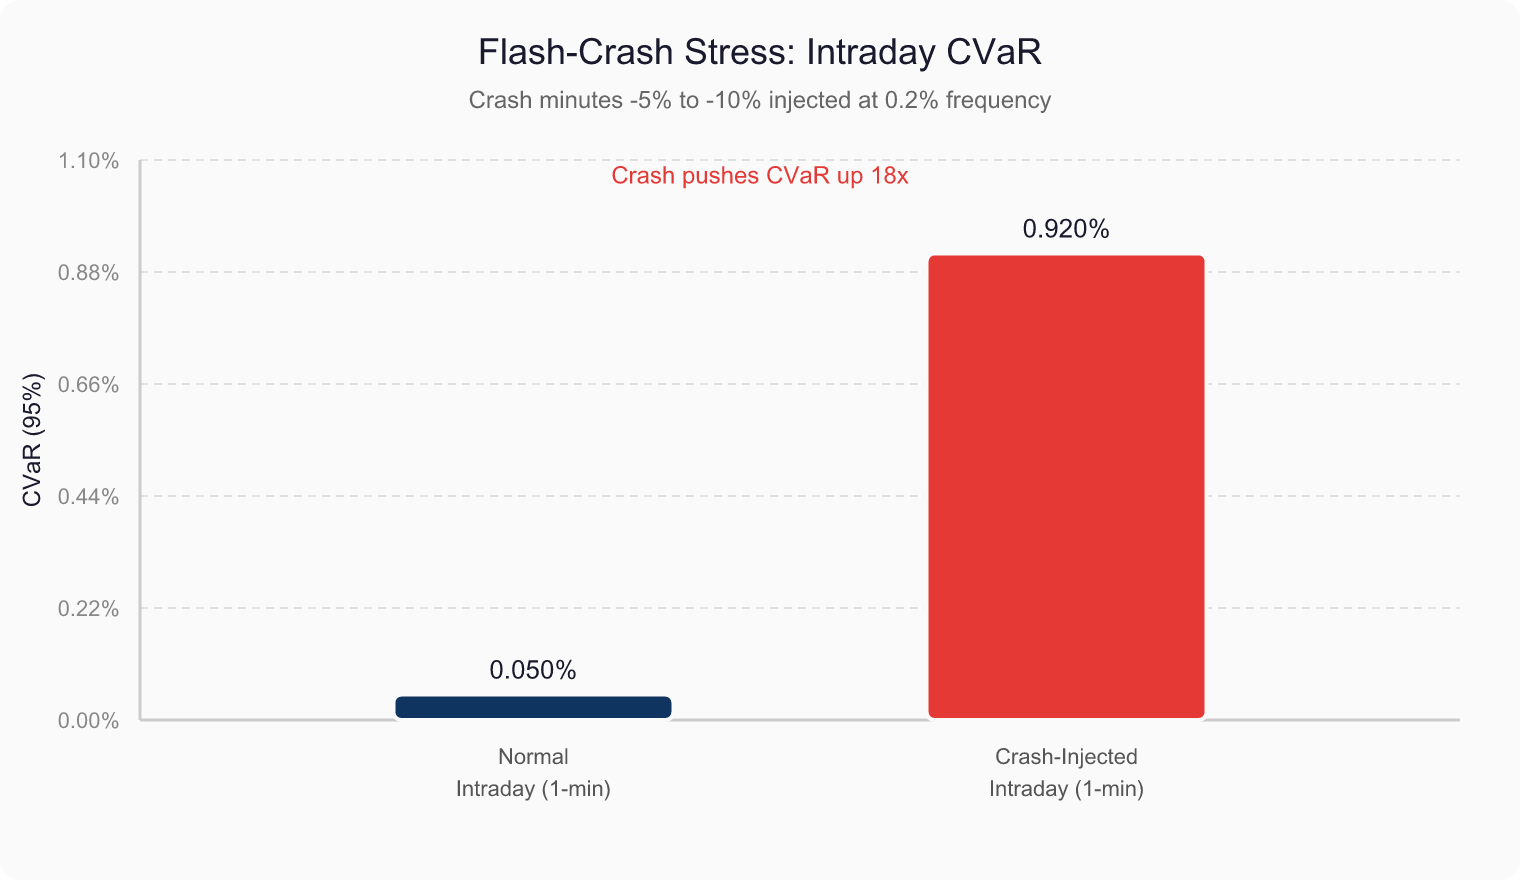
This is the finding that stuck with us. Starting from a calm stretch of the feed, baseline CVaR of 0.0005, we injected crash minutes into the return series, drawing losses from -5% to -10% a minute. Extreme for a single minute of a large cap, but that's what a stress test is for. Crash conditions push CVaR up by a factor of 18, to 0.0092.
The daily comparison is where we have to be careful. Our sample covers roughly seven trading days, so we have seven daily closes, nowhere near enough for a meaningful CVaR, and we are not going to pretend otherwise. Our injection does not model the case that hurts most either: we draw one-sided losses, so they would still register in a daily close. The real blind spot is the move that round-trips inside a session. A daily bar records the net of a day, not its shape, so a crash that falls and recovers before the bell leaves almost no trace in the series a daily model reads.
A model reading that same session through daily bars has one observation to work with, and no way to separate a violent session from a quiet one that closed in the same place. If your risk pipeline runs on daily data and a flash crash hits, that isn't a rounding error. It's a structural blind spot.
Tick level, and what the raw stream shows
The feed goes deeper than one-minute bars. Atlas Feed delivers every individual trade tick, and the picture changes again. The tails you measure depend on the resolution you measure them at: tick-level CVaR is 0.00012, one-minute CVaR is 0.00061, about five times as high. The feed gives you both from the same connection, without stitching together two vendors.
Streaming, and what live data shows
Everything so far has been historical. Atlas Feed also streams in real time, so we subscribed to live updates on three symbols and let it run.
The update intensity is where the microstructure reveals itself. NVDA gets 137.8 updates per second, AAPL gets 47.7, MSFT gets 13.1. These aren't price changes. They're quote and trade updates, the most direct read on liquidity there is. Of the three, MSFT is the most expensive to trade and updates the least. Illiquidity shows up in the update rate before it shows up in the spread. No historical source can show you this; by the time you're looking at it, it has already changed.
A batch CVaR allocation across the three comes out at 60.75% AAPL, 28.04% MSFT, 11.22% NVDA, tilted hard away from the highest-tail-risk name. But at this point the model is still blind to what trading actually costs.
Live spreads change the portfolio
The feed also delivers live bid-ask snapshots on demand. We pulled them for the full 10-stock universe and subtracted each name's half-spread from its expected return before optimising. The idea is simple: if getting into a position costs you money, that cost should hit the name's expected return, and the optimiser should feel it.
COST has the widest spread at 43.6 bps, and its portfolio weight drops by 6.3 percentage points when you turn on spread awareness. AAPL has the tightest spread at 5.2 bps and barely moves. The correlation between spread and weight shift is -0.97: the optimiser tilts away from illiquid names almost perfectly in proportion to how expensive they are to trade.
These are point-in-time snapshots, not time-averaged, and they are wider than the spreads we see in the live stream. For the same names the streaming capture shows AAPL at 1.0 bps and NVDA at 1.2 bps. The snapshots were taken outside regular-hours trading, and they are not consolidated NBBO. The spread-aware weights are a proof of mechanism, not a production allocation. What matters is the correlation: the optimiser responds to trading costs exactly as it should, and it can only do that when the feed delivers them.
Why the data is the point
The CVaR formulation is the same regardless of what you feed it. The linear program doesn't know or care whether the scenarios came from daily bars or tick data. The difference is entirely in the data. Daily bars are the default because they're the default, but they smooth away exactly the structure that drives real portfolio risk: the opening spike, the regime switches, the flash crashes, the spread costs, the update rates. Running CVaR on daily data is like navigating with a map that's been blurred. You can see the coastline. You just can't see the cliffs.
Atlas Feed gives us the cliffs. Every minute, every tick, every quote update, every spread, in real time. The data is the edge. The optimiser just needs to be fed.